
Related Articles

Whether you’re new to the stock market or thinking of getting back into it or a seasoned investor, one question must have troubled you always i.e. How To Find Best Shares To Buy then this article is for you.
Every year thousands of people lose their hard earn money in buying and selling stocks without actually knowing the right method of investing in them. Reasons commonly seen for losses are emotion-driven buying and selling stocks, or investing on some pity WhatsApp tip, etc.
This article will not only guide you on trackers like share market basics for beginners or how to invest money in the share market, but it will also educate old and serious investors about the science behind Finding Best Shares To Buy.
Before beginning, we would like to inform that learning’s of this guide is based on Four Basic Principles Of Value Investing coined by the world most successful investor i.e. Warren Buffett, they are:
- Share must have long term prospect.
- Share / company must be managed by vigilant leaders.
- Share must be stable & understandable.
- Share must be undervalued.
NOTE: We advise investment only in those shares who have passed all the screening tests mentioned in our guide. So, let’s begin & enlighten yourself with knowledge on How To Find Best Shares To Buy
Step 1 : Primary Screening
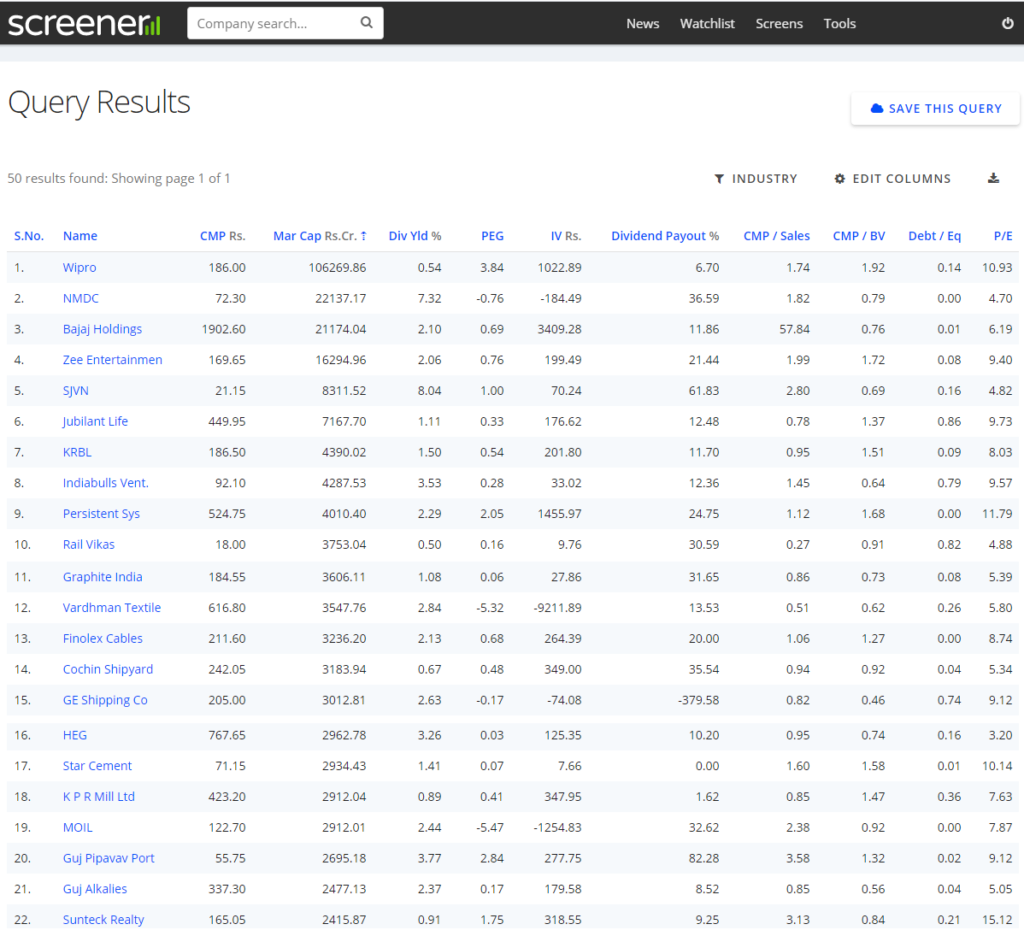
It’s the first step of filtering shares on very broad but fundamentally very important parameters. For this, we will be using any stock screener (I prefer screener.in, as we can download relevant data in excel form for free).
Parameters are :
- Market Capitalization Greater than 500 Cr
Rationale: investing in start-ups & new companies are the job of venture capitalists or big investors, but for retail investors like us, a company size should be optimum.
- P/E Ratio (Price to Earning) Less than equal to 30
Rationale: P/E ratio shows how much money has to be invested for earning Re. 1 from a share, the higher the P/E number the more you will have to spend for earning money on that share. According to Warren Buffett a value investor always invest in those opportunities that give higher return against the least investment. For developed countries like US or UK ideal P/E ratio is less than 15, but a country like ours that is still developing and the market is not mature ideal P/E for us should be 30 & below.
- P/B Ratio (Price to Book Value) Less than equal to 3
Rationale: Book value in gross terms means if the company get liquidated today its per-share value will be equal to its Book Value, in another way we can say it is the actual value of the company. Like P/E, P/B tell how costly our investment is in real terms, so for our country its ideal value should be 3 & below.
- Long Term Debt to Equity Ratio (D/E) Less than equal to 1
Rationale: one of Warren Buffett’s core principles is share / company must be managed by vigilant leaders, this can gaze by how leaders / owners are handling company debt. It’s a proven fact that if an organization continuously remains under debt it can’t generate free cash for itself, thus affecting its future growth prospects. So for any company ideal Debt to Equity ratio is less than 0.5, but considering our nation economic status ideal value for us should be less than 1.
- Current Ratio Greater than 1.5
Rationale: this ratio shows the liquidity status of any company to pay its short-term (less than 1 year) obligations. The ideal value for us is 1.5, which means the company have enough cash to pay its short term debts. The formula for the Current ratio is Current Assets divided by Current Liabilities.
These two ratios i.e. Debt to Equity & Current ratio are very useful ratios that tell investors about company (share) long & short term health (debt) status. To give this discussion a real-time perspective names like Kingfisher, IIFL, DHFL, Yes Bank, will tell you how important these ratios are. As even seasoned kept on investing their hard earn money in these debt-ridden companies resulting in a complete loss.
At this juncture, our tip to the new investors on questions like how to invest in the share market or how to buy shares always remains well under the above five mentioned values for becoming a Value Investor. Once we execute the above standards in Screener.in, the system will show the desired results. Further, we will test companies on other parameters to filter it further.
One most important aspect you should keep in mind before moving forward is that you will be seeing names of many companies who are well known & tempting; do not get driven by your emotions on buying them at this stage. Remember, this is just the first step of screening there are two more steps for finding the best shares to buy.
Step 2: Secondary Screening
In this step, we will test our filtered shares further on Warren Buffett basic principles.
- Finding the share having long term prospect: from the list of shares filtered in step 1 (fig 1) select the companies whom do you think will exist after 20 to 30 year from now, to simplify filter the companies whose products will be of use many years from now. To exemplify products like software, news, pharmaceuticals, educational courses, etc will exist no matter how much scenario of world changes. It can be assessed just analyzing company profile, product catalogue, etc.
Rationale: share must have long term prospects is the founding principle of value investing. For value investor companies whose products have relevance even after 20-30 years are the right candidates for the best shares to buy list. It is just like someone investing in typewriter companies early 1900 (1900 – 1960) and not investing in the same during the late 1900 (1980 to 1999).
Need more clarity to consider this, a company that manufactures candies could be considered having long term prospect as its products will be consumed even after many years from now. So, buying shares of such a company will give confidence to investors that the share has a good future & it will stay in the market for long.
| S. No | Company | Industry | Long Term Prospect |
| 1 | Wipro | Information Technology & Consulting | Strong |
| 2 | Finolex Cables | Electricals & Communication Cables | Medium |
| 3 | Jubilant Life Sciences | Pharmaceutical & Bulk Drugs | Strong |
| 4 | Star Cement | Cement Manufacturing | Week |
Like the above table, you could make list of shares having a strong long term prospective for further analysis. For the guide & for a better understanding of concept, we will use Wipro Ltd as an example for further steps.
- Finding Share Stability : now from list of shares having strong long term prospective, we will evaluate Wipro on further steps & benchmarks. Here we will analyse the stability of share on basis of its returns.
Jot down Wipro Earning Per Share (EPS) for the last 10 years (at the time of making this guide March 20 was available). After jotting it down take out YOY EPS growth (as given below), we are looking for a positive growth trend in EPS, as given below. As you can see in our example of Wipro YOY EPS growth rate is near to ideal, as in the last 10 years is has de-grown only once, so it could be ignored.
NOTE: if you are seeing any –ve sign in EPS Gr only once or twice in 10-year record that too in small numbers we could safely ignore it.
| Years | Mar-10 | Mar-11 | Mar-12 | Mar-13 | Mar-14 | Mar-15 | Mar-16 | Mar-17 | Mar-18 | Mar-19 |
| EPS Gr | 6% | 10% | 29% | 9% | 3% | -3% | 1% | 12% | 14% | |
| EPS | 8.1 | 8.5 | 9.4 | 12.1 | 13.2 | 13.5 | 13.1 | 13.3 | 14.9 | 17.0 |
Rationale: EPS is an important criterion for any value investor, as it is the actual amount that an investor earns per share from its investment. As per Warren Buffett we should only invest in those shares that have a proven track record of giving returns, it is just like putting your money on a winning horse. Moreover, as an analyst you could get a clear idea of how much return your investment will give in coming years. For our current example of Wipro its average is 11% for the last 10 years.
- Finding Share Intrinsic Value : in real terms this fundamental aspect show us whether our selected share is cheap or costly to buy. For calculating intrinsic value of share we need to calculate last 10 to 15 years share’s P/E ratio. For that jot down last 10 year EPS & market price, then divide Market Price by Earning Per Share for calculating P/E ratio. Do this for all the years as given below.
| Years | Mar-10 | Mar-11 | Mar-12 | Mar-13 | Mar-14 | Mar-15 | Mar-16 | Mar-17 | Mar-18 | Mar-19 |
| EPS | 7.1 | 8.1 | 8.5 | 9.4 | 12.1 | 13.2 | 13.5 | 13.1 | 13.3 | 14.9 |
| MP | 160 | 181 | 166 | 164 | 204 | 236 | 212 | 193 | 211 | 255 |
| P/E | 22 | 22 | 19 | 18 | 17 | 18 | 16 | 15 | 16 | 17 |
Further, take out the average of P/E for these years, which come out to be 18 for Wipro. Multiply 18 with the latest EPS number which is 17, which come out to be 306. 306 is the Intrinsic Value for Wipro, on comparing it with the present market price (Rs. 190), it is much lesser than the share intrinsic value.
So, we can safely say that our share is undervalue. And as a reference, its Margin of Safety (difference between Intrinsic Value & Market Price) is 116.
Rationale: the most important Warren Buffett principle is buying a share when it is undervalue, even from the investor point of view we should buy instruments only when it is cheap (i.e. When Intrinsic Value Is More Than Market Value). From this step, one more thing we could observe about share, that its P/E value has come down from 22 to 17 in the last 10 years, which means Wipro share is becoming cheaper.
- Analyzing Share Sales Parameters : Although it’s not that important but it will be wise to take note of it, as it give us idea about how company sales is performing. Here we looking for positive figure under company sales & profit heads. For Wipro it is 8.67% & 8.89% sales n profit growth respectively, which is certainly a decent number for such a big & prominent company like Wipro.
Rationale: a company which have a YOY growth in its sales & profit head, shows that its products are accepted in the market & have relevance to customers.
Step 3: Tertiary Screening
By this stage we will get almost certain whether to buy a share or not under our study, so for sample share Wipro Ltd all parameters have been passed by it. But for a true Value Investor plugging all gaps before investing is most important because the most basic investment strategy is “Not Losing A Single Penny”. So let’s move to our last screening lap:
- Return On Equity : here we will calculate last 10 years average Return On Equity of Wipro. Minimum expected value should be more than equal to 14%. For Wipro it stands around 17% so this is too a green signal for us.
- Price To Sales Ratio (PSR) : can be calculated through following steps; first divide annual sales (in Rs.) with number of outstanding shares for calculating Sales Per Share (SPS). Then divide Wipro Market Price by SPS, which come out to be 1.93. It is to be noted that ideal PSR value is less than 1.50, for our economy any value less than equal to 2 is acceptable.
Rationale: PSR measures the relative valuation of a company against its revenues, it is quite useful for evaluating companies in cyclical industries. So lesser the value healthier the company.
- Free Cash Flow Analysis : now it’s the time to analyse company cash flow, for that we have to record last 10 year value of cash flow from Operating Activity and Capital Expenditure (usually term as CAPEX) it’s the investment done on building fixed assets for company. Both can be extracted from cash flow statement, Capital Expenditure can be seen under Investing activity head.
| Year | Mar-10 | Mar-11 | Mar-12 | Mar-13 | Mar-14 | Mar-15 | Mar-16 | Mar-17 | Mar-18 | Mar-19 |
| Operating Cash Flow | 5,100 | 4,044 | 4,009 | 6,394 | 6,790 | 7,840 | 7,887 | 9,277 | 8,423 | 11,632 |
| Capital Exp | -1103 | -1221 | -1298 | -875 | -889 | -1285 | -1395 | -2085 | -2187 | -2278 |
After jotting these figures as above, we have to calculate two values i.e. Free Cash Flow (FCF) & FCF ratio. FCF can be calculated by subtracting the value of Capital Expenditure from the value of Operating Activity, this number should be highly positive. Moving forward divide FCF by the value of operating activity & multiply by 100 giving us the FCF ratio, it’s should be more than 50% for these years.
| Year | Mar-10 | Mar-11 | Mar-12 | Mar-13 | Mar-14 | Mar-15 | Mar-16 | Mar-17 | Mar-18 | Mar-19 |
| FCF | 3,997 | 2,823 | 2,711 | 5,519 | 5,901 | 6,555 | 6,492 | 7,192 | 6,236 | 9,354 |
| FCF Ratio | 78% | 70% | 68% | 86% | 87% | 84% | 82% | 78% | 74% | 80% |
For Wipro both FCF & FCF Ration is positive & above 50% respectively, which is a positive sign for us.
Rationale: for a company whose leaders have sound knowledge about market basics, pay huge emphasis on free cash flow. This free cash flow can be invested for business growth or can be used to stabilize organizations during the risky market situations, etc. So this number (FCF) should always be highly positive & improving. Whereas a constant capital expenditure shows that leaders are thinking long term & building a fixed assets for the company future. So, the green signal under these numbers gives a positive outlook for a company future & internal health.
So, through our three-step analysis, we could safely say that Wipro has passed all the screening benchmarks and thus we can recommend it for rewarding investment.
Here for explanation sake, we have taken just one example, but you could evaluate many such shares on given benchmarks in the same way as we have done. By doing this you could prepare your own list of Best Shares To Buy.
NOTE: To make your work easy we have designed a Stock Analysis Excel. In which you just have to enter required numbers to analyse the health of the share and it will automatically inform you on whether to buy this share or not. Interesting ! so do not wait just Click Me to subscribe & your Stock Analysis Excel will be sent directly to your mailbox. We will continue our learning in our subsequent blogs in which we will discuss topics like How to Do Advance Analysis of Shares, How to Track your Shares, When To Exit From Share, How To Choose Best Mutual Fund & many more.